Exploring Rude Britannia
After plotting some rude tweets in Rude Britannia, I think it will be fun for us to take a gentle stroll around rude Britain, pausing to look every so often when something catches our eye.
The Words
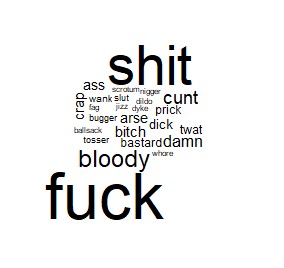
Since we’re analysing text, I’ve created a word cloud of the rude terms (based off of this banned word list) which I used to search Twitter and build my data set.
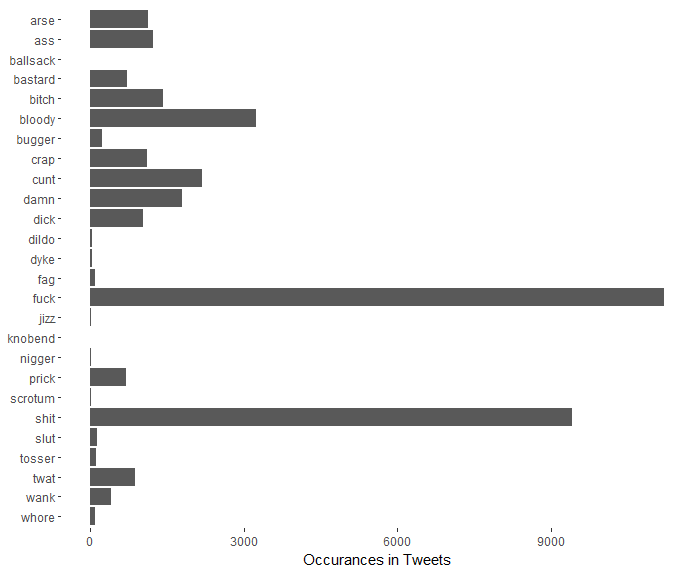
Word clouds look cool and give us a fun overview of the data, but if we really want to see what’s going on, we’re best sticking with a simple bar chart. We can clearly see all the words I searched for and how often they appear in my result set. My search query always included all the words you see, but I don’t know how or if Twitter prioritised certain words over others.
We see that “fuck” and “shit” are by far the most common rude words in the data set and that there are a whole bunch of middle to low frequency rude words such as “ass” and “damn”. I’m pleased to see that the quintessentially English “bloody” is reasonably represented, coming in 3rd.
According to the Washington Post, “nigga” is used more than “bro” and “dude” so it’s surprising that “nigger” doesn’t make a stronger appearance. It could be that us Brits don’t use the word as much as Americans, or perhaps if I searched for nigga instead of nigger we’d get a different picture. The Twitter serach string is limited to around 20 words, so I decided not to search for any alternate spellings.
The Places
In Rude Britannia we briefly looked at where the tweets came from, by plotting them all on a map. Let’s take a moment to examine this a bit further.
For a tweet to be tagged with a location, the user must enable location tracking on their profile. When these users tweet, we’re told that it came from somewhere inside a geographic box but we don’t know precisely where. The boxes give us an idea where the tweet came from without telling us the exact co-ordinates so we can’t for example, figure out the street someone lives on. These boxes can be nested and they are assigned to Twitter places.
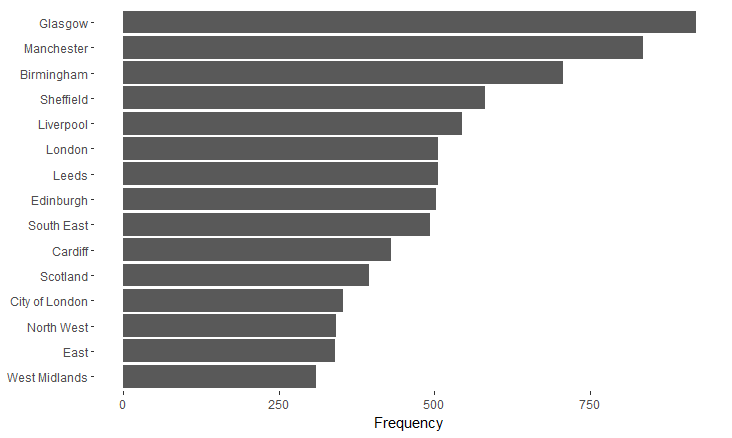
A Twitter place can be the entire UK, a region of the UK (the South East), a city (London), a part of a city (Camdem Town - London) or a building (Kings Cross Station). These bars show how many tweets came from the top 15 Twitter places in the data set.
The bars show us that Twitter attributes most of the rude tweets to the major UK cities. Interestingly, London with 9 million inhabitants has fewer rude tweets than Glasgow with 600 thousand inhabitants. Does this mean Glaswegians are ruder (or more prolific tweeters) than Londoners? Probably not, I suspect ‘London’ is composed of many more Twitter places than Glasgow, indeed, both “London” and the “City of London” are in the top 15 Twitter places.
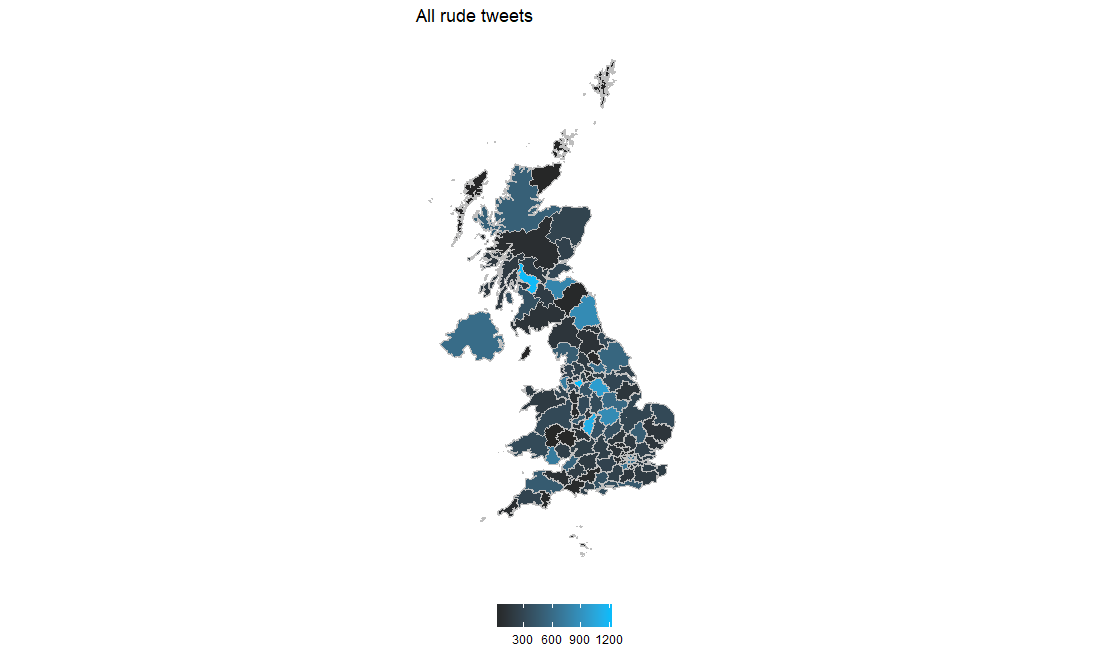
To then plot tweets on a map I use the UK postcode area boundaries from Open Door Logistics. I attribute a tweet to the postcode that the center of the tweets box sits in.
Areas with major cities stand out except London which again looks under-represented. A bit of history can help explain why. During the 60’s the modern postcode system was rolled out across the UK. This system consolidated many smaller areas into a few bigger ones. Most cities and their surrounding areas were assigned one postcode area, except London which kept its many small areas.
My maps don’t account for geographic size, population or total count of tweets so distributing ‘London’ rude tweets across many postcode areas diminishs their weight. I have considered normalisation but it would make the data answer: who uses x proportionally higher than others. I don’t care that the Outer Hebredians use “fuck” in all their rude tweets that I happen to have. I do care that Glasgow uses “fuck” the most.
From now on, when we talk about a place, let’s use the postcode area that the center of the tweet’s box falls in.
The Days
We have a feel of the rude words and where they come from, lets now check when the tweets were made. I didn’t do anything particularly scientific to build my database of tweets. I have some code that grabs the maximum tweets allowed from the free Twitter API. I would run the code then give it about 30 minutes to cool down before running again. I ran it for several days in February 2017.
The major features of note is that there is nothing from a Wednesday and the data is skewed towards Friday and Saturday. The distribuion of days probably just highlight when I remembered to grab some tweets. It’s not impossible that I spent a lazy Saturday or two in front of the TV, grabbing tweets every so often.
More of the Same
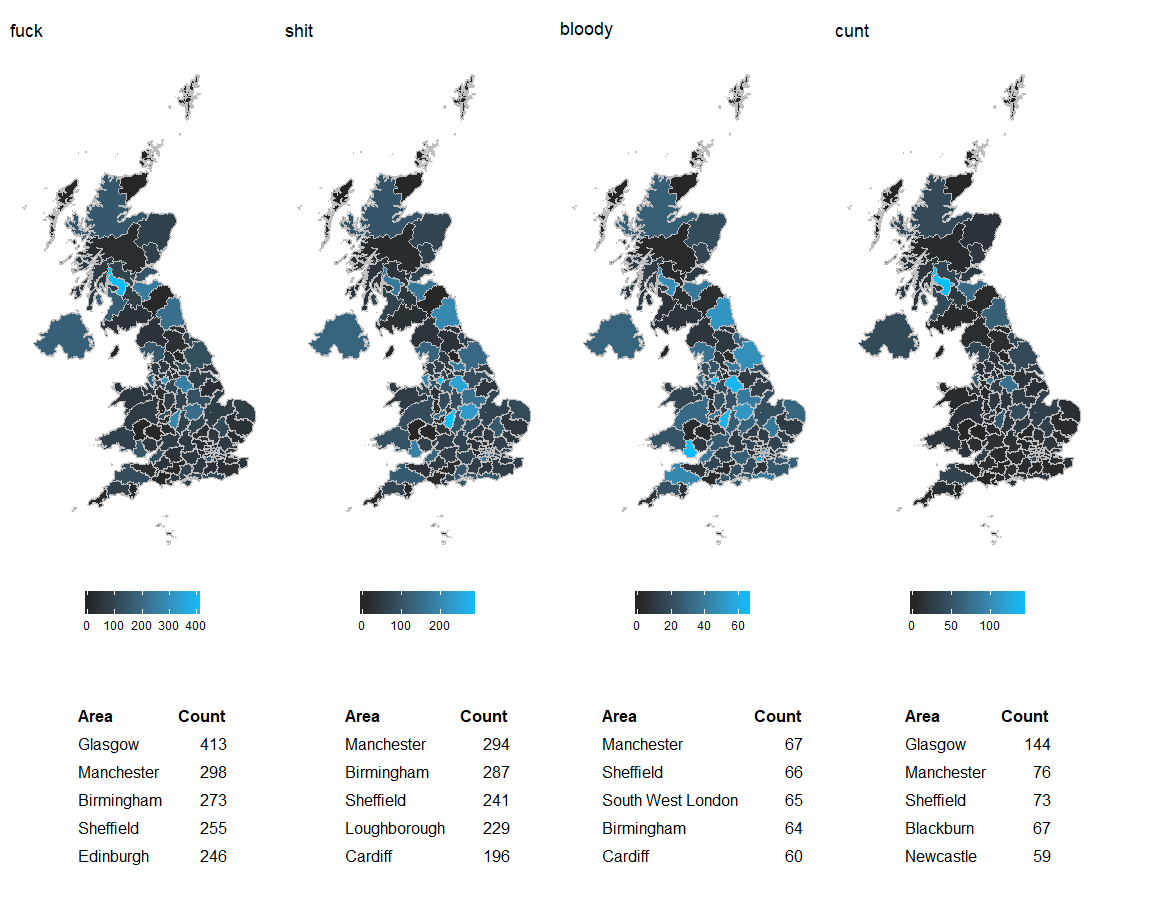
In the previous post we only looked at where “fuck” is used. This time, let’s look at a few more words. These are the most popular rude words in my data set.
From eyeballing the maps we see the general pattern is the same as the overall trend, except for “cunt” which is used very intensely in Glasgow. In Glasgow “cunt” appears 144 times but across the rest of the UK appears on average 17 times per region. “Bloody” is used less intensly (a peak of 67) but is more ubiquitous and is used an average of 20 times per region. This higher average makes “bloody” a more popular word than “cunt”.
One Word
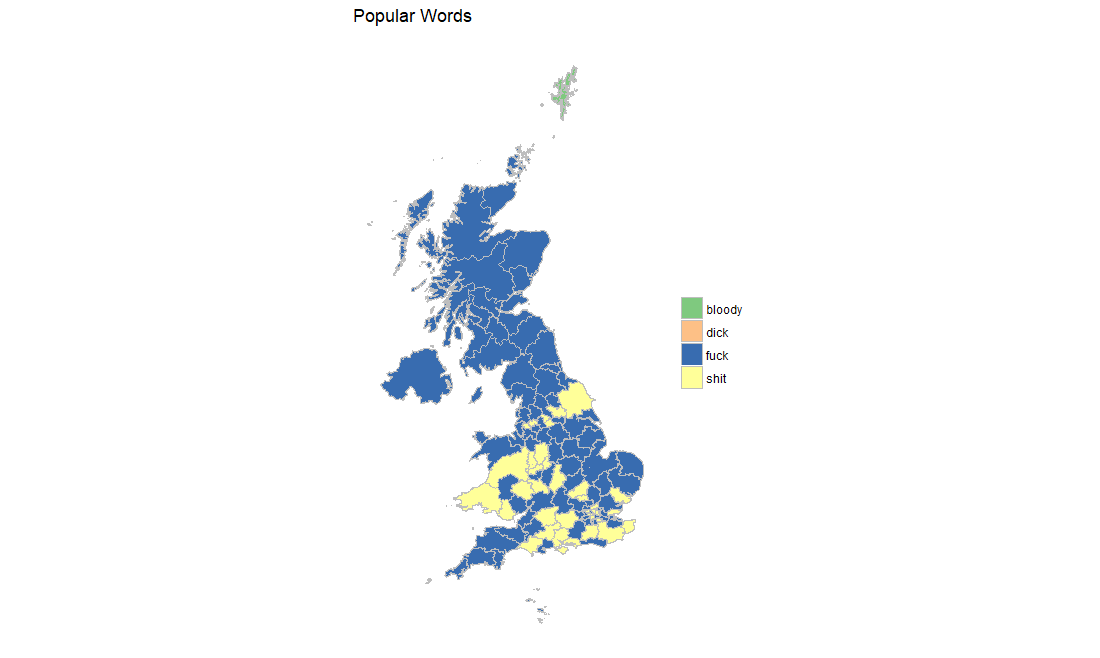
We’ll now look at each regions most popular rude word. I’ve coloured the map by the top rude word.
Most places have “fuck” and “shit” as their most popular word but we have one place with “dick” and one with “bloody”. Nowhere has “cunt” for the most common word. The area with “dick” for the most popular rude word is West Central London. It has 3 tweets, one of which uses “dick” twice. Lets have a look:
Just seen Dick from Dick and Dom, he's also watching #DreamGirls tonight #Excited
Someone has run into a children’s TV presenter from the 90’s and they’re both seeing the same play at The Savoy. Disappointingly wholesome. Meanwhile in Bloody Orkney, sorry, the Shetlands, someone is impressed with Beyonce.
Beyoncs Grammy performance is bloody amazing
Networks and Trees
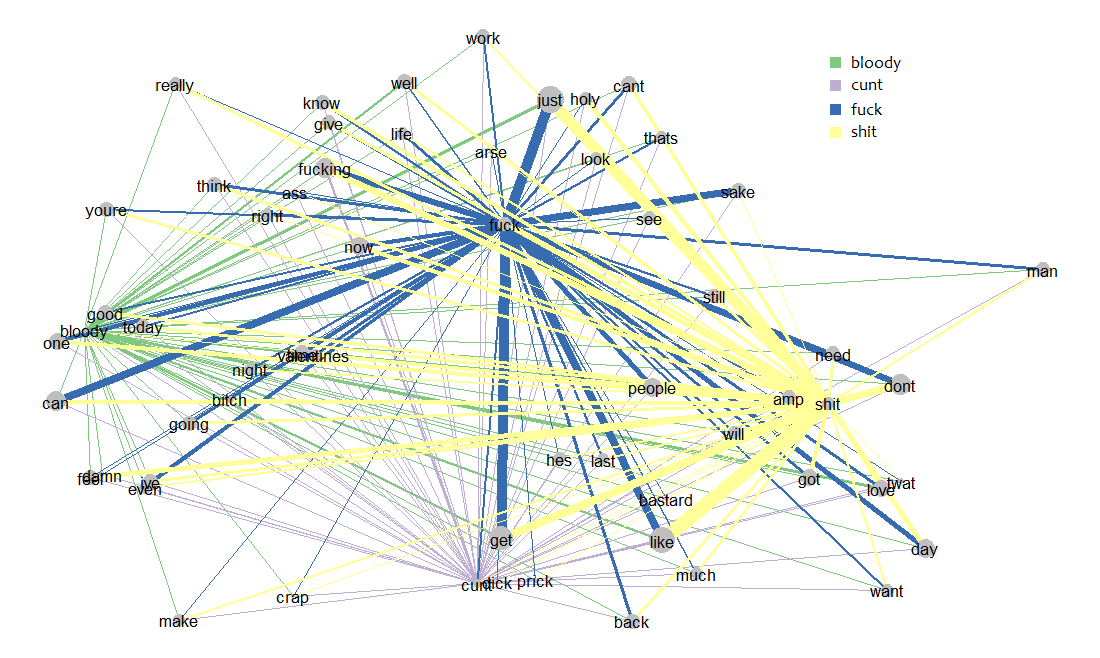
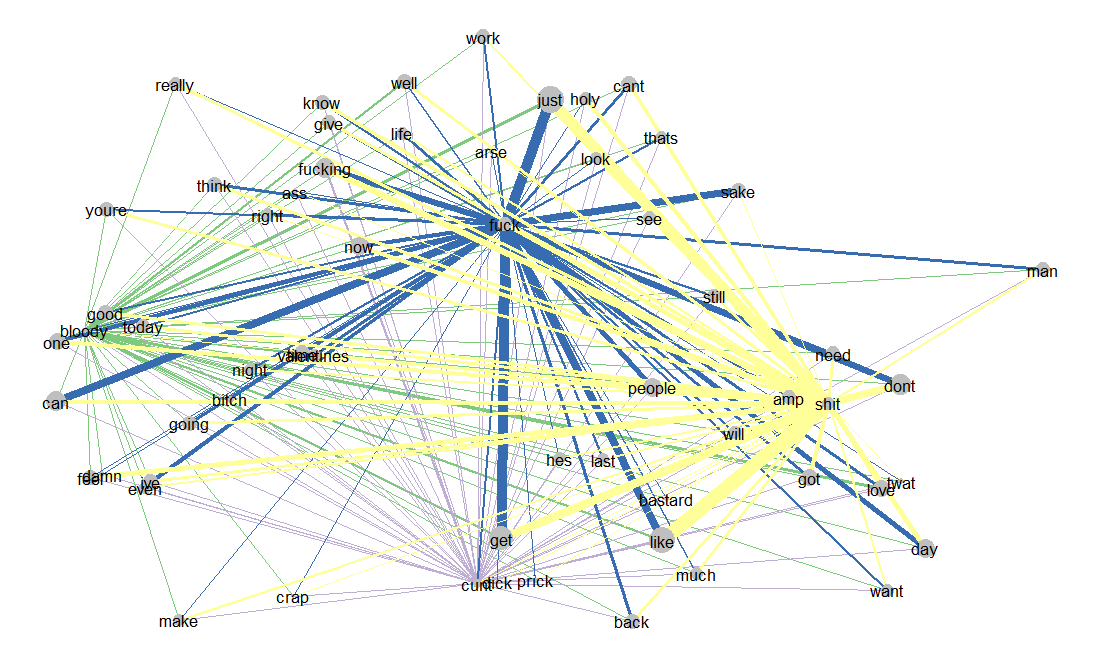
We can have a look at what some of our rude words relate to. I’ve created a network plot which shows relationships to “fuck”, “shit”, “cunt” and “bloody”. To create some semblence of clarity I’ve trimmed the plot so it only shows words that are used more than 500 times. I’ve coloured lines based on the rude word they map to. The position of the word is the programs attempt to make the plot readable.
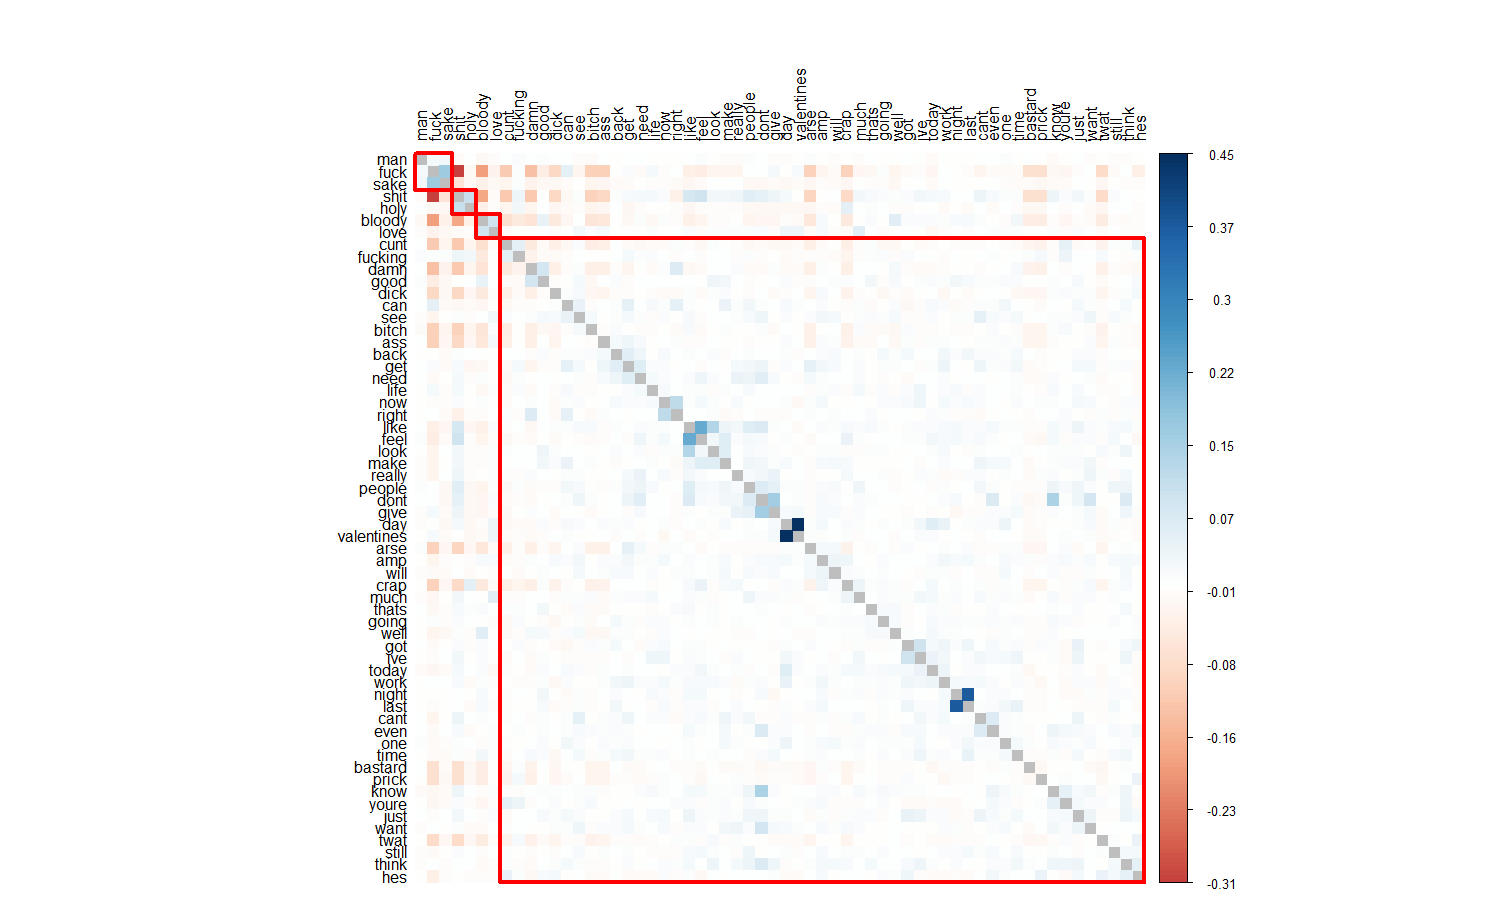
I find the plot quite hard to follow so I calculated the correlation between all pairs of words (this time allowing all words to match each other). This matrix shows us a sample of the correlations. When there is positive correlation between a pair, we expect both words to be used in the same tweet. A negative correlation suggests that if one word is used, we are unlikely to see the other.
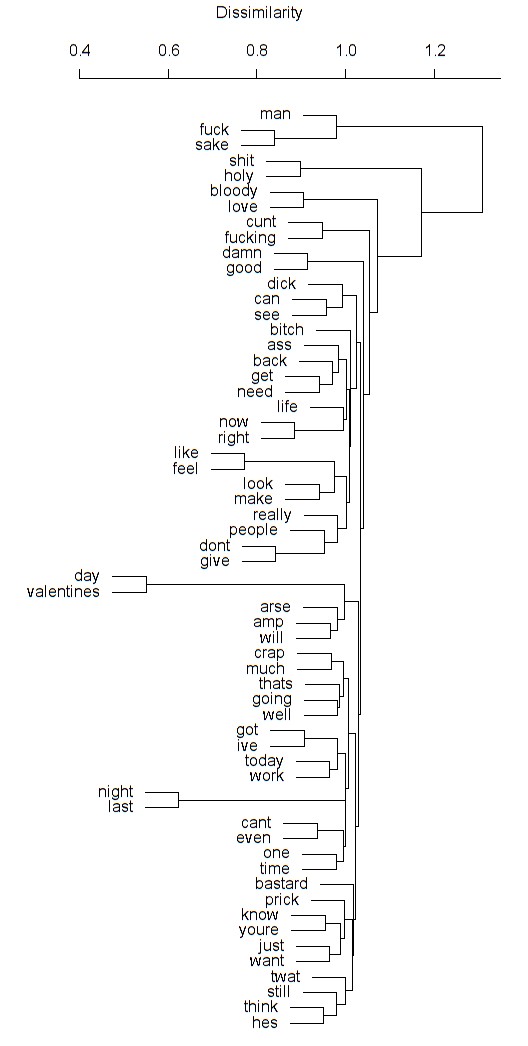
I used the correlation to calculate the dissimilarity of each pair. Words that perfectly correlate have 0 dissimilarity, words with negative correlation have the maximum dissimilarity of 2 and everything else sits between these values.
I then paired up words with the smallest dissimilarity to form clusters and build the dendrogram that we see below. This page describes the process in more detail. I’ve tipped the image on its side to make it a bit easier to read. Take a moment to look through it and I’ll join you below.
It is re-assuring that we see some common phrases, it suggests that everything we’ve seen so far is correct. We get “fuck sake” which groups up to “fuck sake man”, the classic “holy shit” and “bloody love”.
Now that we’ve opened up our analysis to more than rude words, we see some groups such as “valentines day” that we wouldn’t otherwise see. However, this is Rude Britannia, not loved up Britannia so let’s see what rude things people are saying about Valentines day.
We have some disgruntled singletons
fuck valentine's day, been to town and bought myself new clothes. don't need no man
Already looking forward to my valentines day wank tomoz ha ha❤❤❤❤
the anti-consumerists (who I assume are also single)
Valentine's day is a load of commercial crap and yes I'm single and bitter
Valentine's day is just a money making scheme anyway, fuck it. I dont care any way
some football fans
Asked the wife if she wanted to watch @MarlowFC v Kempston Rovers on valentines day, she said fuck off! Happy days I'm going without her
Fuck Valentine's Day Champions League is back
and a pancake lover.
Fuck Valentine's Day it's pancake day in 2 weeks that's what I'm all about
Thank You and Goodbye
This last plot ties everything together. It shows us the correlation between words as a heatmap and draws a box around the major clusters. This empasises the major clusters of “fuck sake man”, “holy shit”, “bloody love” and everything else.
I’ll leave it up to you to see what’s interesting in this plot.
I hope you enjoyed this, thank you for reading.
