Queen Victoria's Tunnels (According to Wikipedia)
I recently found myself stating that most of England’s railway tunnels are from the Victorian era. Being a somewhat analytic person, I shortly found myself creating a plot to see if this was true.
Wikipedia has a page with all the tunnels in the United Kingdom. I used this handy tool to scrape the data and then loaded it into R.
library(dplyr)
library(ggplot2)
library(stringr)

tunnels <- read.csv("C:\\Users\\Chris\\Documents\\Data\\wiki_tunnels\\wiki_tunnels.csv",
                    stringsAsFactors = F)
Some tunnels were opened in stages, like the Copenhagen Tunnels in London, some didn’t have opening dates and some are flagged “Due to open 2017”, such as the Crossrail Tunnels…

I clean out these tunnels and filter Wikipedia so that it only gives me railway tunnels.
colnames(tunnels) <- c("county", "tunnel", "type", "lengthMeters",
                       "lengthYards", "notes", "dateOfOpening", "coordinates")

railTunnels <- tunnels %>% filter(type == "Railway") %>%
  # some tunnels open on 'multiple' days ie, when multiple tracks open over time

  filter(str_detect(dateOfOpening, "[:digit:]{4}"))

# dates got loaded as chr

railTunnels$dateOfOpening <- as.integer(railTunnels$dateOfOpening)
I then count how many railyway tunnels we’re dealing with to get a sense of the data.
# how many rows were excluded by only showing tunnels with one opening date

tunnels %>% filter(type == "Railway") %>% summarise(n())
nrow(railTunnels)
These counts show that Wikipedia has 339 railway tunnels, 285 of which have one opening date. This freedom of information request has a spreadsheet listing nearly 600 tunnels.
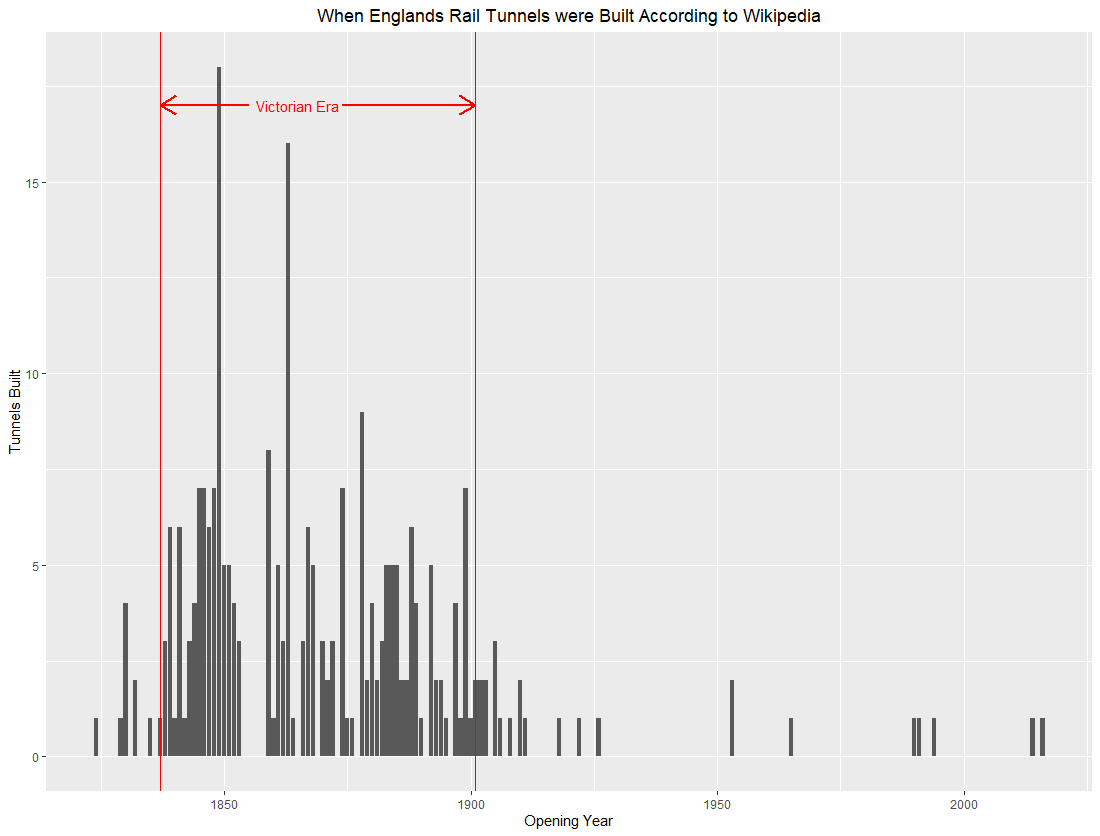
The two sources are counting slightly different things - the freedom of information request is all Network Rail Tunnels and covers England, Scotland and Wales. The Wikipedia list show railway tunnels in England and includes the London Underground but does not look at Scotland and Wales. I’ll sweep this difference under the carpet, and plot when England’s railway tunnels were built (according to Wikipedia).
I use ggplot to make the histogram and mark up the Victorian era.
ggplot(railTunnels) +
  geom_histogram(aes(x = dateOfOpening), stat = "count") +
  # Victoria reigned between 1837 and 1901

  geom_vline(xintercept = 1837, colour = "red") +
  geom_vline(xintercept = 1901, colour = "red") +
  theme(plot.title = element_text(hjust = 0.5)) +

  ylab("Tunnels Built") +
  xlab("Opening Year") +
  ggtitle("When Englands Rail Tunnels were Built According to Wikipedia") +

  annotate('text', x = 1865, y = 17, colour = "red", label = "Victorian Era") +
  geom_segment(aes(x = 1855,
                   xend = 1837,
                   y = 17, yend = 17),
               colour='red', size=1,
               arrow = arrow(length = unit(0.5, 'cm'))) +
  geom_segment(aes(x = 1874,
                   xend = 1901,
                   y = 17, yend = 17),
               colour='red', size=1,
               arrow = arrow(length = unit(0.5, 'cm')))
We see the Victorians built about 80% of the railway tunnels in the England! This number sounds very high but if you are willing to believe on uncited, somewhat sensationalist statement in Wikipedia that …Parliament authorized 8,000 miles of lines at a projected cost of £200 million, which was about the same value as the country’s annual Gross Domestic Product (GDP) at that time.
it could be plausable. On face value this is quite a bit more than the 1.7% of GDP we spend on transport in 2016 and 2017 however, Wikipedia only says when the Victorian money was authorised, not when it was spent.
Thanks for reading.