White elephant gift exchange
TODO: Insert some jolly words about Christmas. 🎄 🎅 ❄ ☃ 🍷 🎁
The White Elephant Gift Exchange is an exciting alternative to Secret Santa. In this game, everyone buys a present of roughly equal value and places it wrapped up in a pile. The first player opens a random present. The next player may open a new present or steal someone’s already opened present. When a player gets their present stolen they may either open a new present or steal a present from someone. A present can only be stolen once per turn. When someone opens a present the turn ends. If the last player thinks a bit, they typically have an advantage because they know what all but one present is, so can take their pick.
A variation to the rules limits how often a present may be stolen. We’ll play around with this rule to see how we can create a fair and exciting game in which players have ample opportunities to steal but minimises the advantage in having the last go.
The Model
I’ve built a model that can play 1000’s of rounds of White Elephant Gift Exchange. Before we start using the model I’d like to understand it a little bit.
The model assumes that no one knows the value of a present before it is opened and when a present is opened each player instantly values it the same way. This means our players don’t value wrapped presents by their size, weight or noise they make; no one has a personal preference for a particular present; and presents don’t become more desirable if they are frequently stolen. Think of the presents as Amazon gift vouchers.
I calibrated the model by running it with 9 players acting randomly (they open or steal without thinking). I chose low, medium and high present values of 1, 5, 10 and put 3 of each present into the pile. Each point on the chart is a players average present value after 5001 games. The error bars are the estimate of standard error of the mean and the dotted line shows the average value of the presents (5.33).
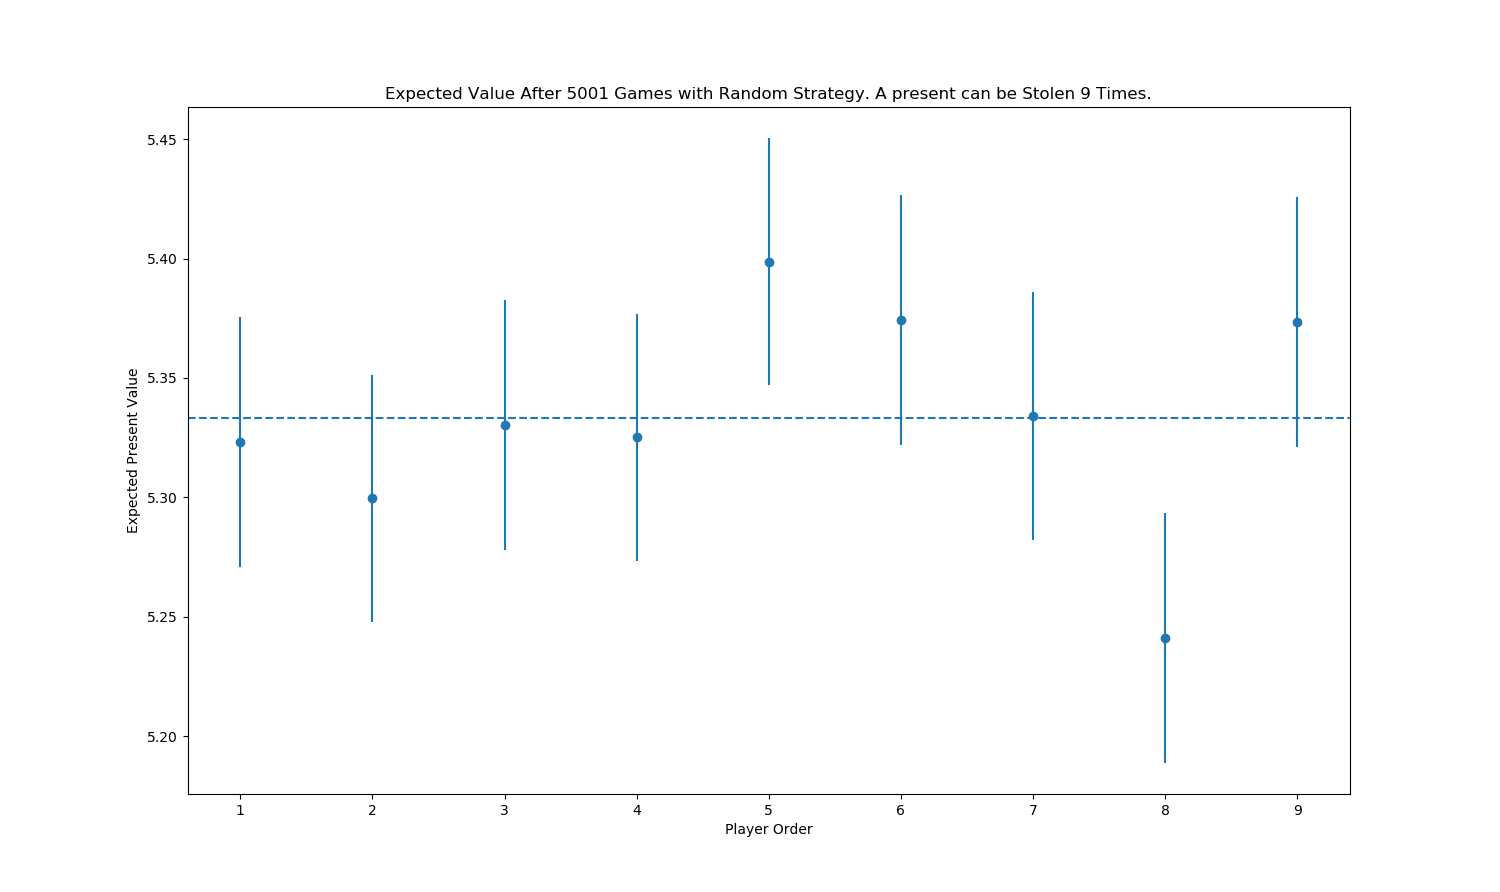
It’s reassuring to see that most of the players end up with the average present value (within error), demonstrating that the model is doing something sensible. I expect that as we average up more games each point gets closer to the average number and has a smaller error.
Running more simulations will decrease the statistical error but it will also increase the time it takes to run. To get a feel for this statistical error I’ve plotted how standard error for one player decreases as we play more games.
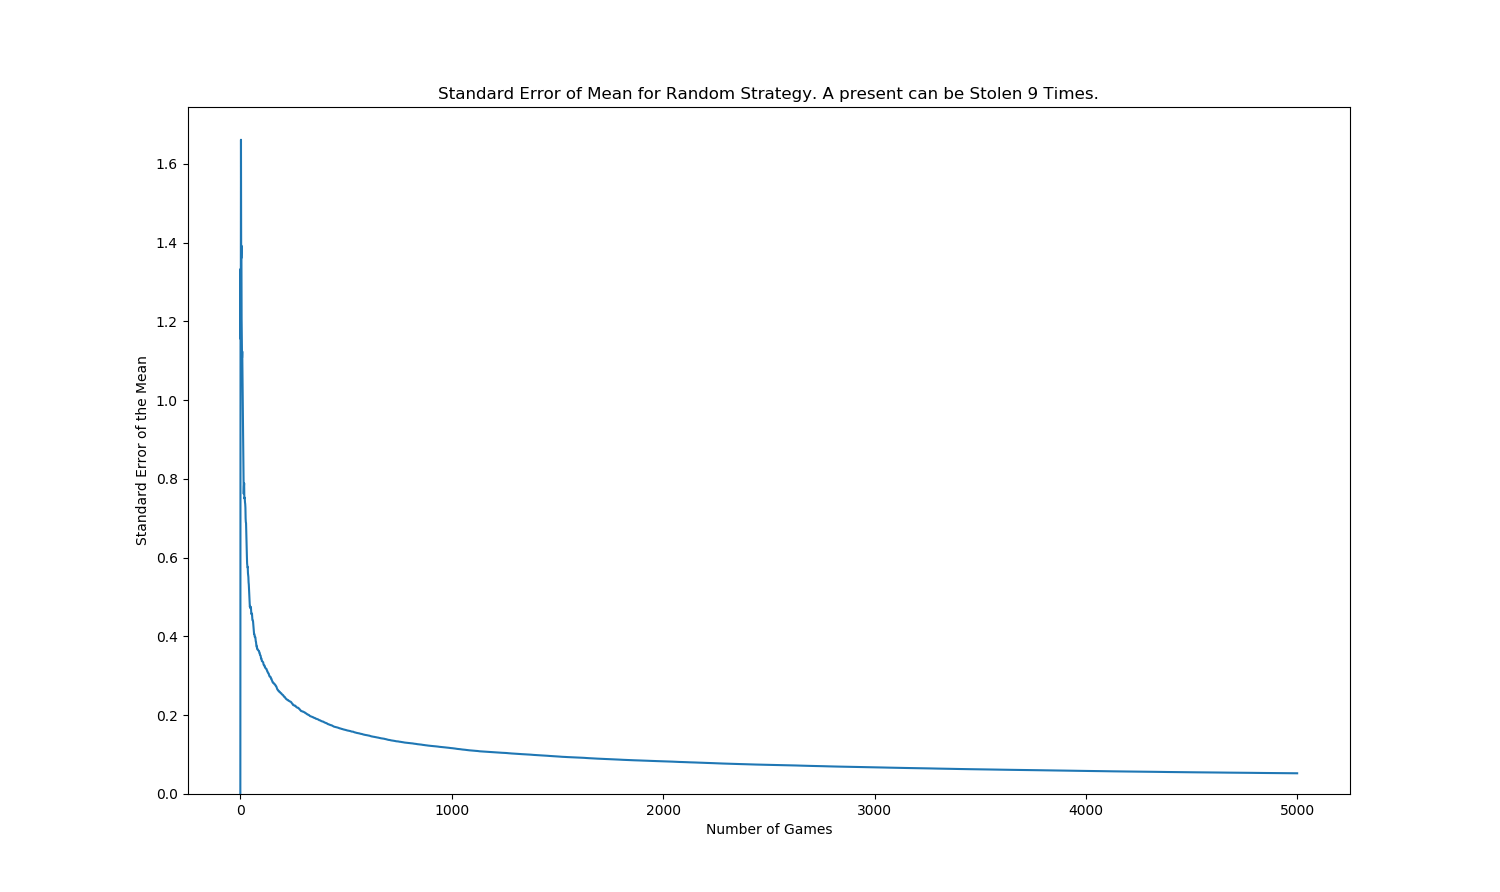
1000 simulations will give me an acceptable error, but you may have higher standards!
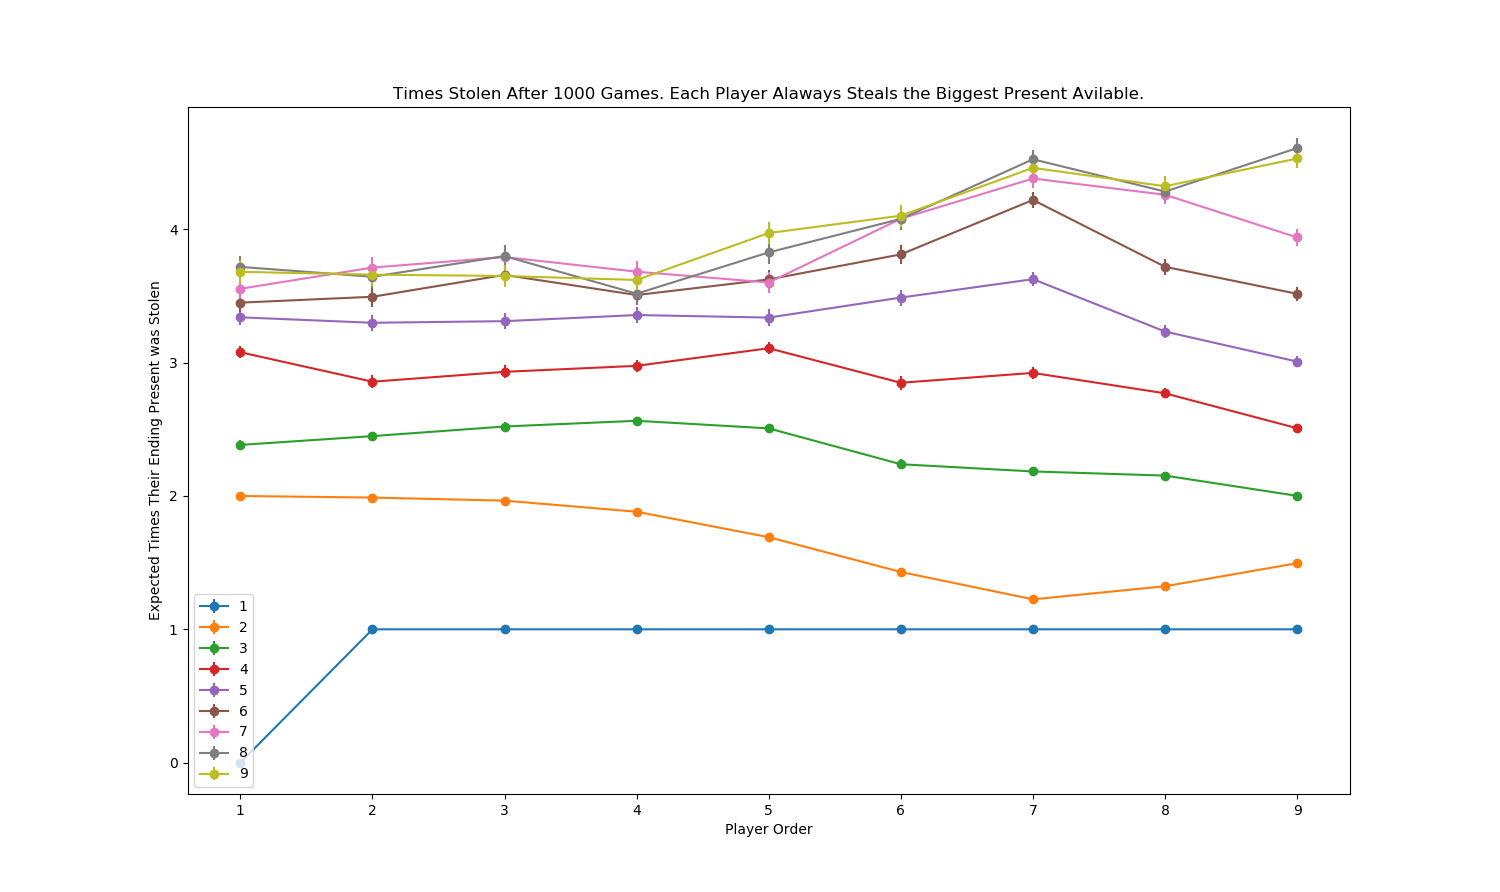
We can also see how often a players final present was stolen. We see presents that later players end up with tend to be stolen more often than presents the earlier players end up with.
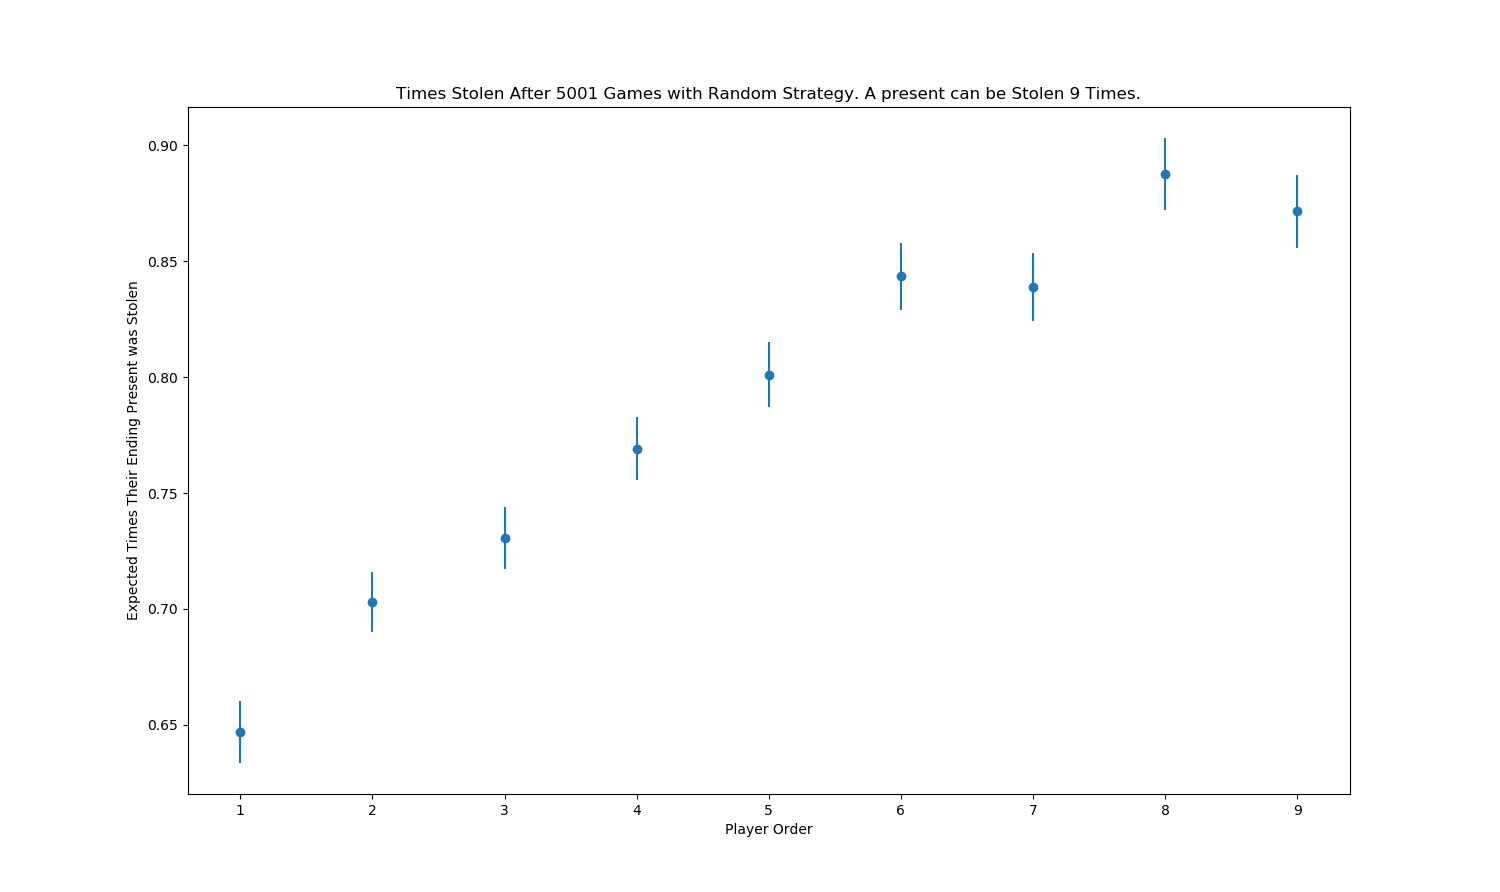
This makes sense considering there is no absolute limit on how often a present may be stolen - only a limit of once per turn. The opportunities to steal a present increase as the game progresses so we see more steals for the final presents of players who go later in the game. It helps to imagine that player 1 may open a present, have it stolen by player 2 who gets it stolen by player 3…
A Strategy
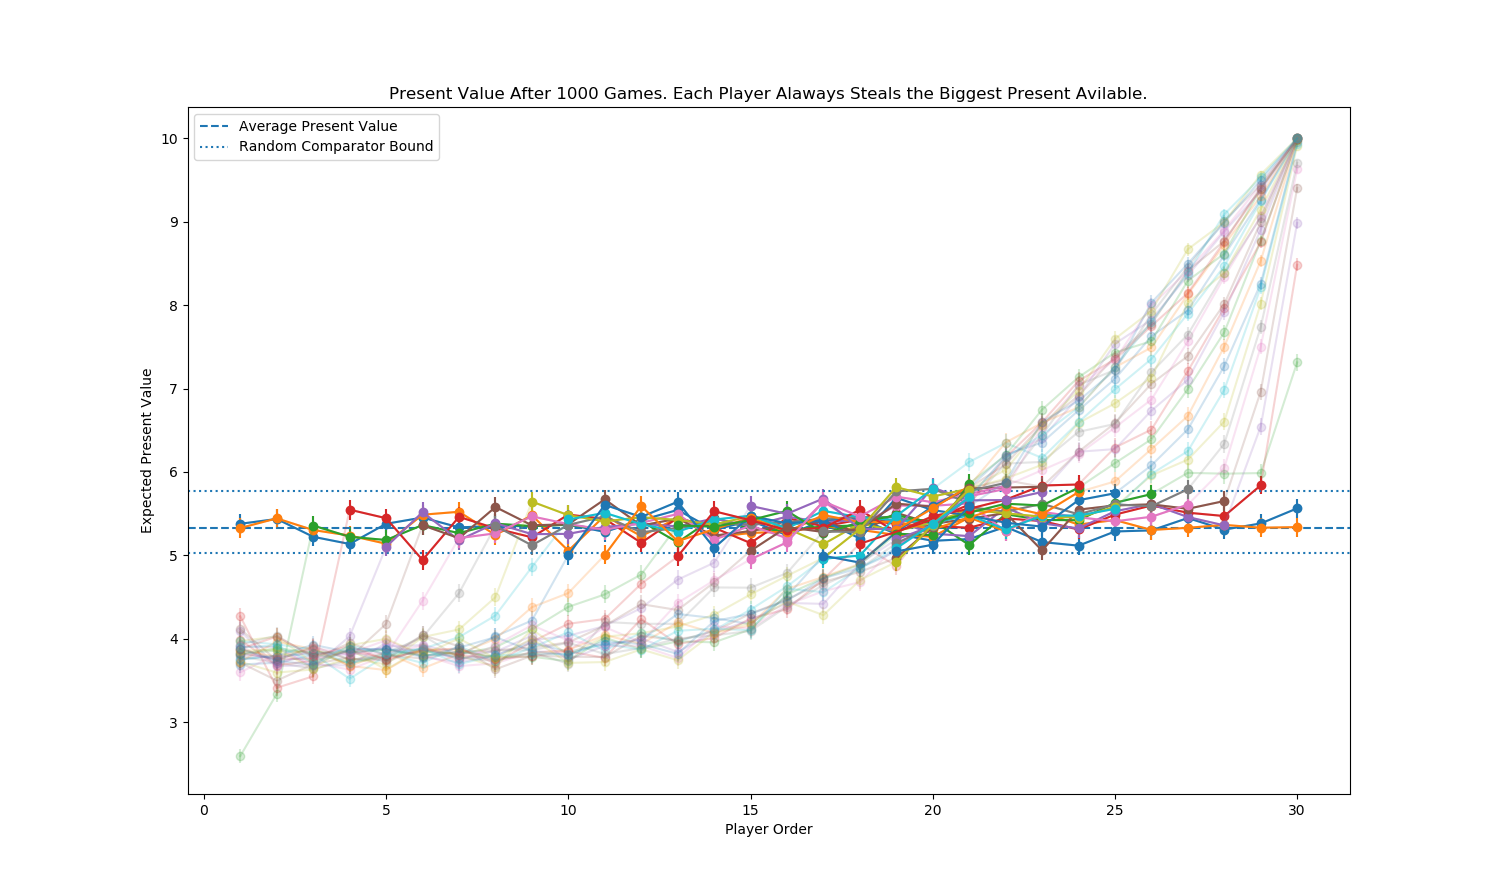
We can make the players a bit more interesting by telling them to always steal the best available present (a present that has been opened and not stolen on this round). If there is nothing to steal they will reluctantly open a present. We will still play with an equal number of presents valued at 1, 5 or 10.
In this chart I show the outcome from 2 strategies: one where none of the players think (play randomly), in the other they always steal the best present available. I played each strategy 1000 times. The dotted line remains the average present value (5.33).
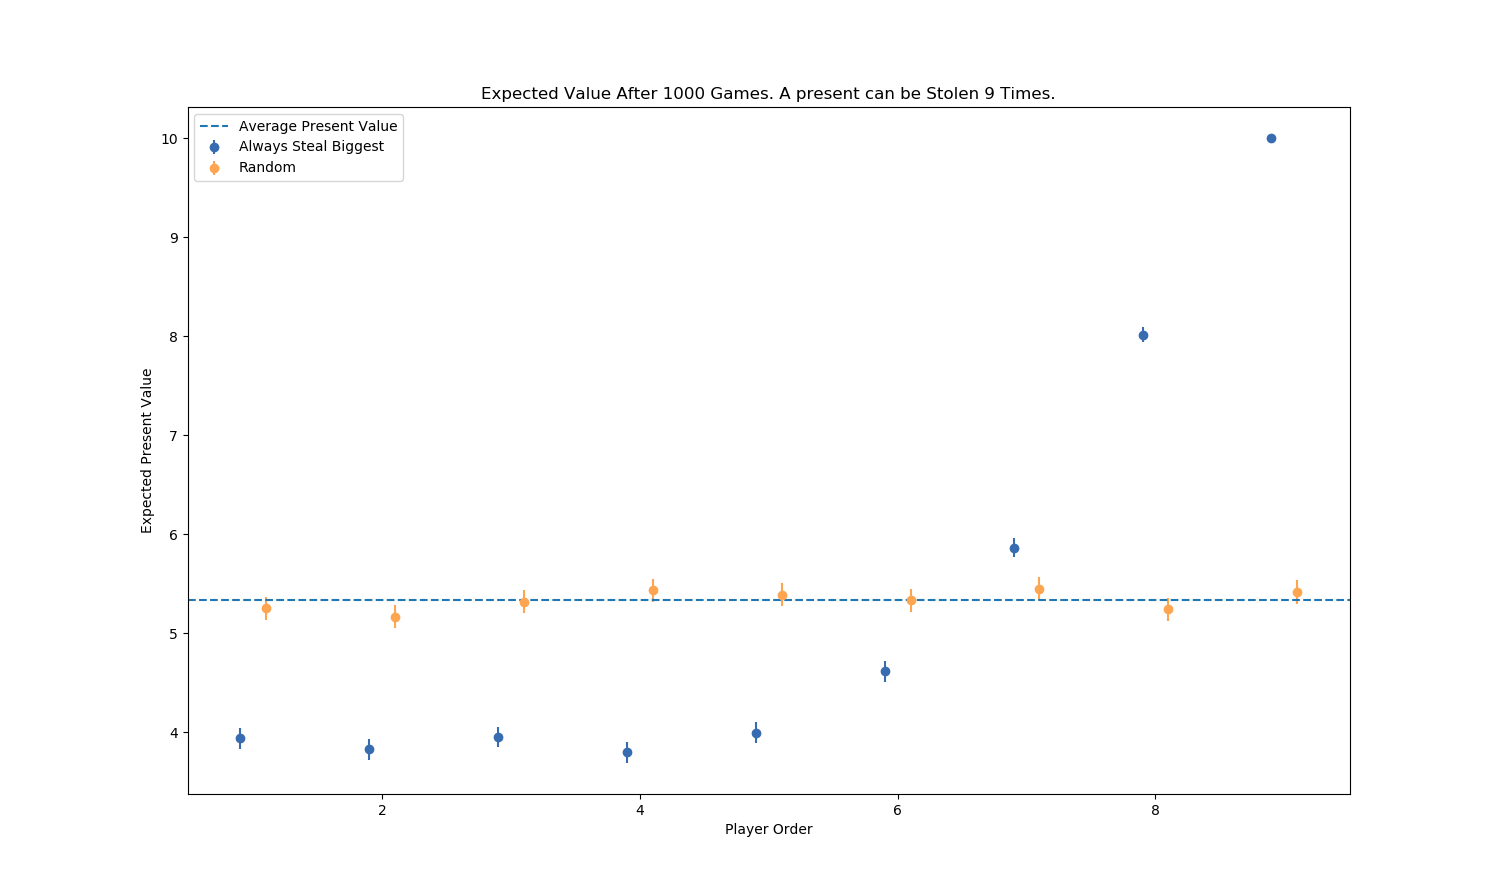
This demonstrates how the game gives a huge advantage to going later. When it reaches the last player, all but one present has been opened and at least one 10 valued present is open. The last player can take their pick from the opened presents (there will be a 10 for them to steal) and no one can steal it off them.
The penultimate player does well because they usually get a 10 valued present but always get at least a 5 valued present. The only time they don’t get a 10 valued present is if none of 10s have been opened by their turn. Similar logic holds for the 7th player.
The remaining players experience an essentially random, albeit unfair game because the top presents have already been stolen and locked out from further steals. The last player to make an action has a small chance of opening a 10 valued present.
A Fair Game
To make the game a bit fairer we can create a rule in which a present may be stolen a maximum 3 times. This allows early players to ‘freeze out’ some of the good presents.
I want a way to objectively measure fair games, so I’ll make this statement:
We can make the game ‘fairer’ by reducing the number of times a present may be stolen. A game with 0 allowed steals will be a purely random selection of presents, ie fairness = 1.
I’ve plotted the same model but with a limited number of steals. I’ve added some lines to show the minimum and maximum values we may reasonably expect to see from a random model. Anything that falls in or touches these lines (within error) is part of a ‘fair’ game. We can measure this ‘fairness’ by comparing the players that have expected present values within the random bounds to those that don’t.
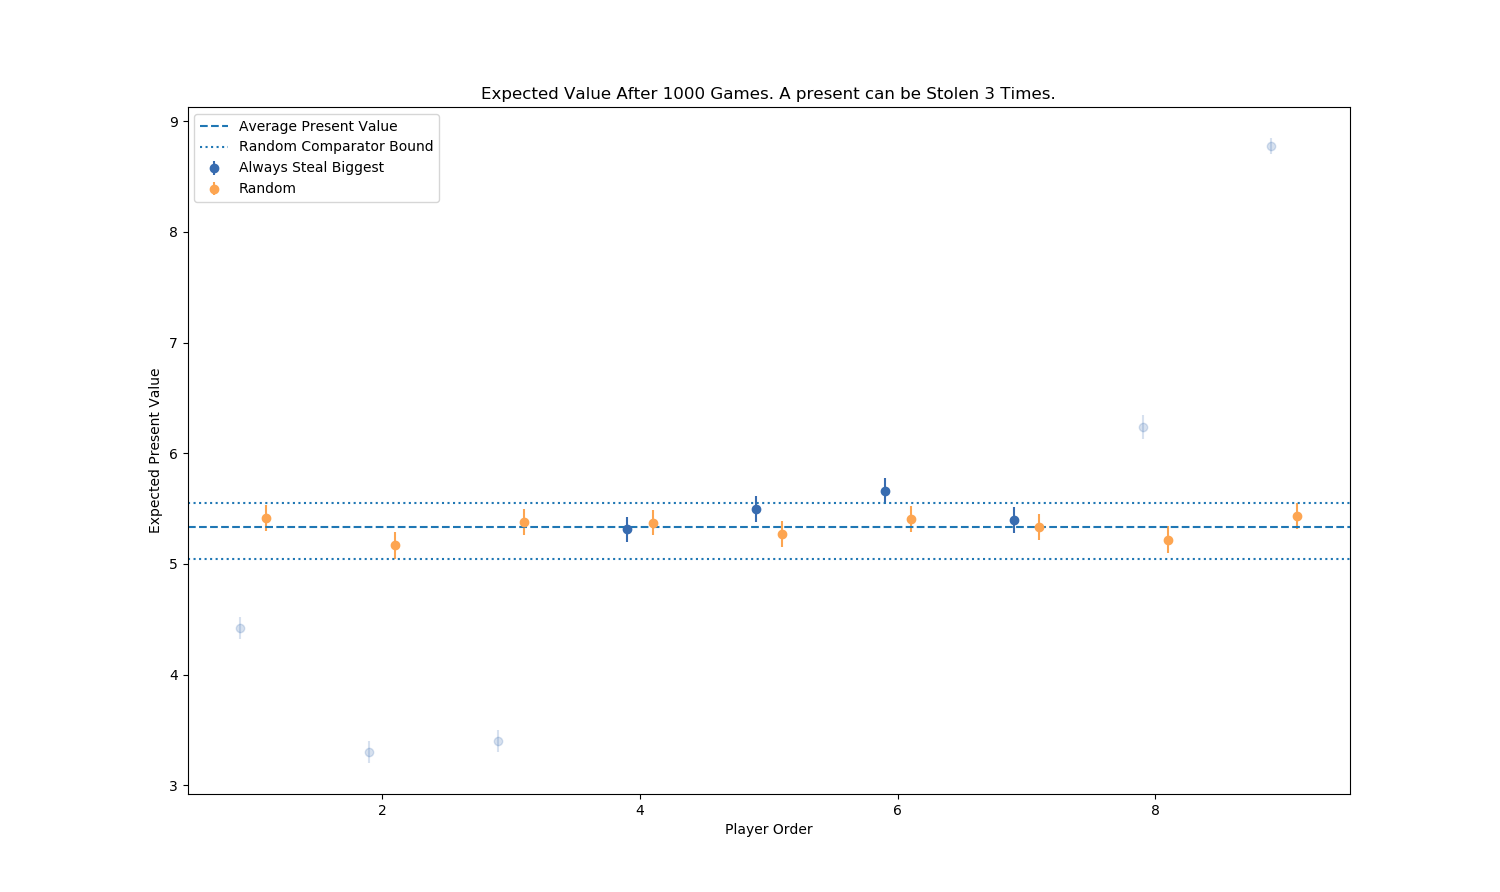
Here players 4,5,6,7 (which I’ve highlighted) have random looking outcomes to give a fairness of 4/9 = 0.4444.
Many Fair Games
I’ve run the 9 present game for steal limits between 1 and 9. Here we see how it affects how often a present is stolen. The graph shows how often the players final present was stolen, per steal limit.
The general trend is as we might expect - when the steal limit is higher, presents get stolen more often. For a steal limit at 1, the first player opens a present. Player 2 must steal their present (it’s how their strategy is defined) and player 1 opens a new present. Player 3 must steal the present from player 1 (they can’t steal steal player 2’s, because it has reached the steal limit), player 1 opens a new present and so on.
As steal limit increases, the steals ‘get compressed’ until hitting an apparent boundary where allowing more steals (6 or more) doesn’t alter how often a present is stolen. There seems to be a peak in number of steals around player 7, this could be from: the random nature of the game; because there are 3 high value presents which players 8 and 9 tend to get; something else; or I’m reading too much into it. I won’t worry about these details now.
We can also see how the steal limits affect expected present values for a player.
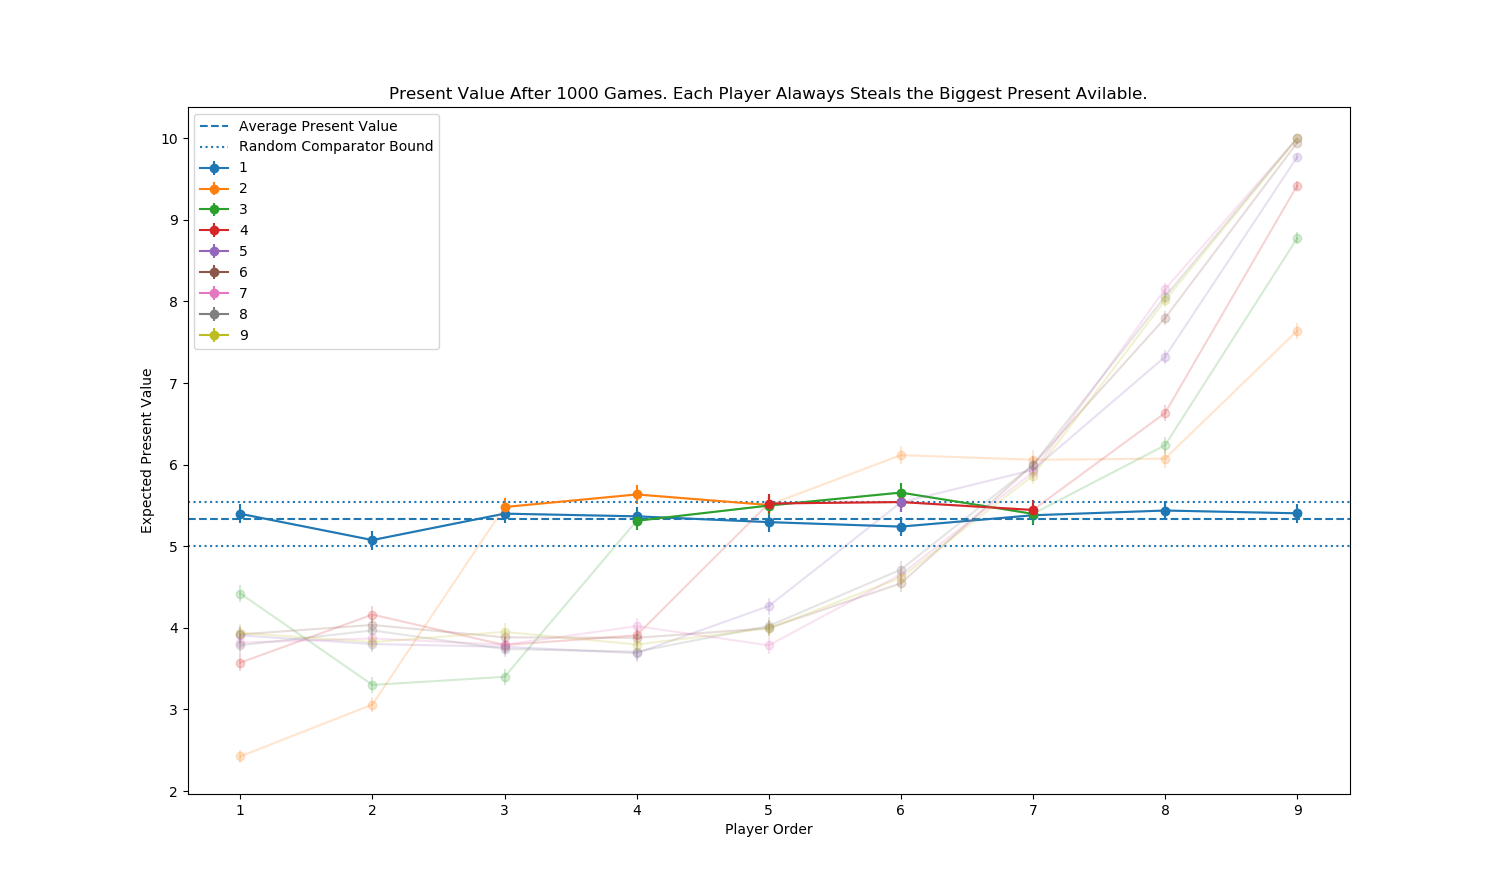
I’ve highlighted the fair outcomes. This shows in a 9 present game only a steal limit up to 4 has some fair outcomes and when a present can only be stolen once the game is completely fair (ie, random).
As a present can be stolen more often the end result gets more polarised between the early and late players. At high steal limits (6 or more) the game settles down - players 1-5 have the same expected value. This is likely because most of the high value 10’s are stolen by the later players, leaving the earlier players to perform a random squabble for the 1 and 5 valued presents with a slight chance of having the last unopened present valued at 10. This behaviour may explain why the stolen counts bunch up.
We can repeat this for many different games with many different steal limits. Here we have all the steal limits for a game with 30 players.
A Fair and Fun Game
Reducing the number of steals makes the game boring. We can create another measure called ‘fun factor’ which is similar to fairness but compares the ratio of allowed steals to number of players. I will make another statement:
A game with 9 players where a present can be stolen a maximum 3 times has a fun factor 3/9 = 0.333.
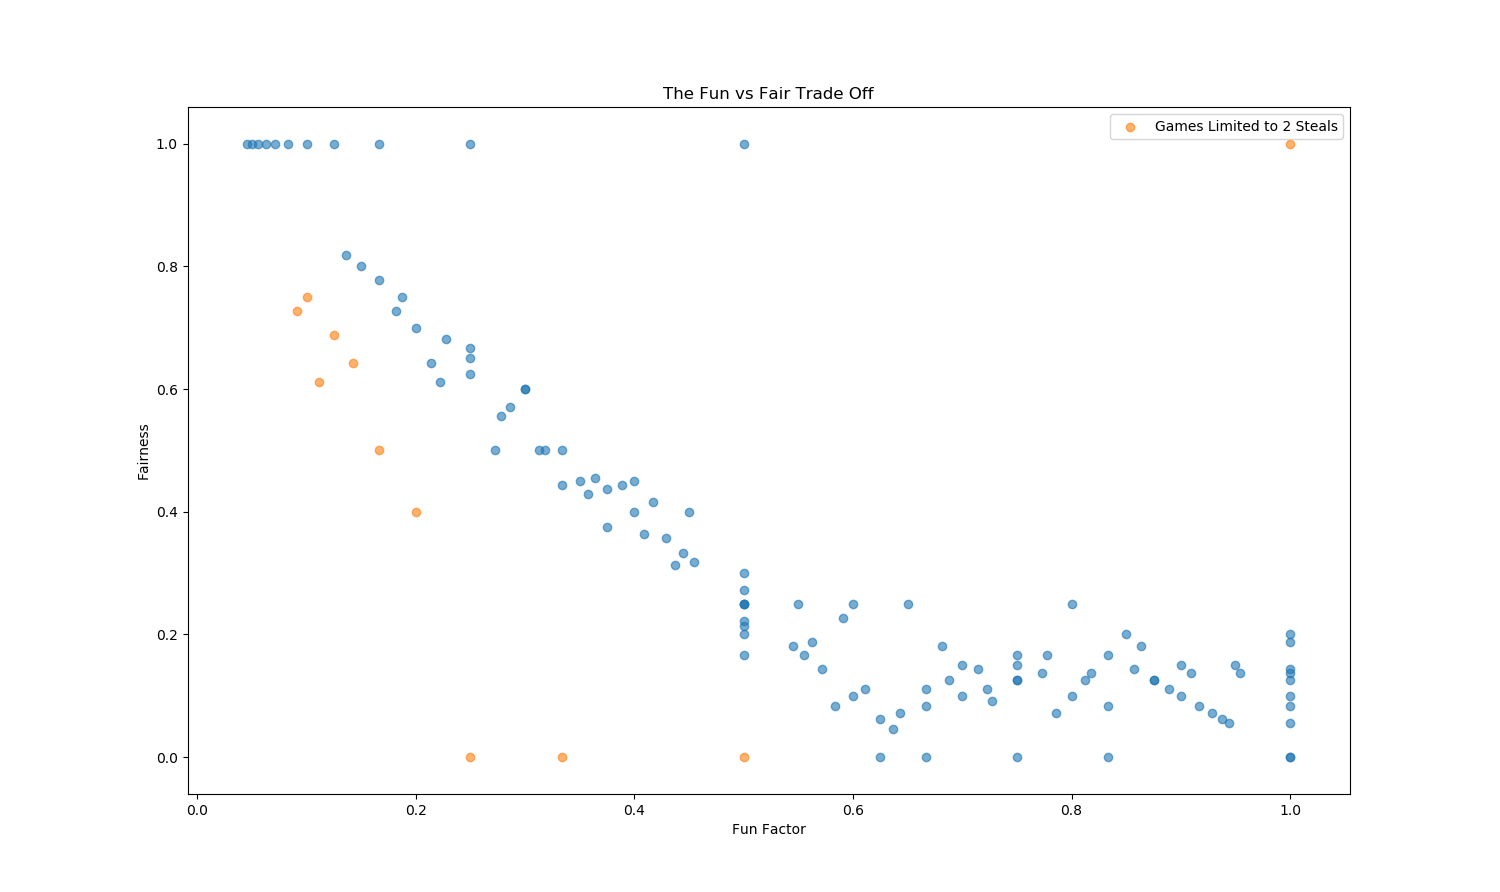
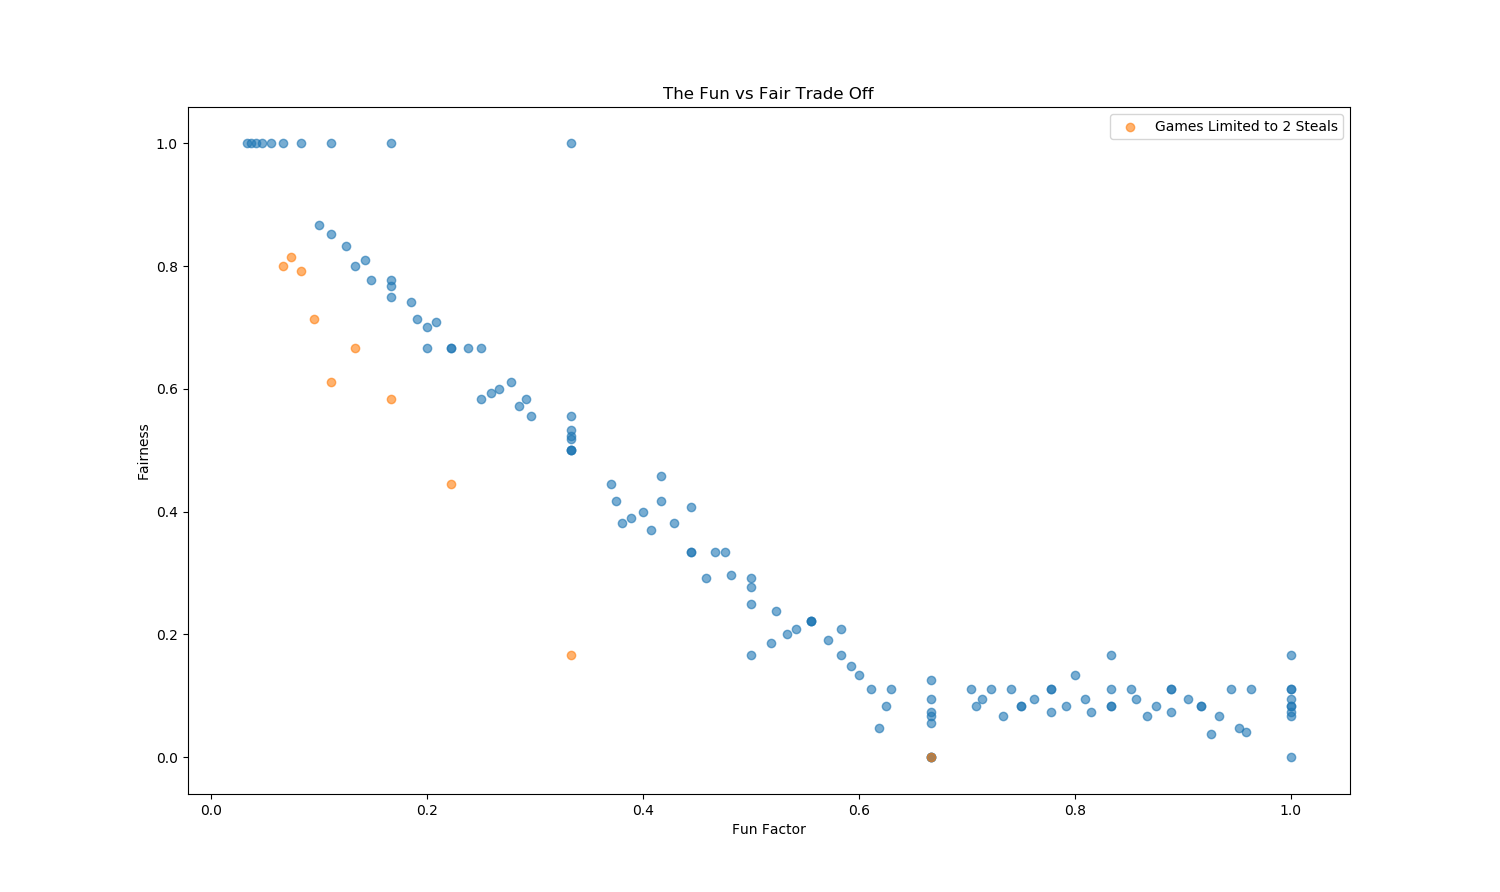
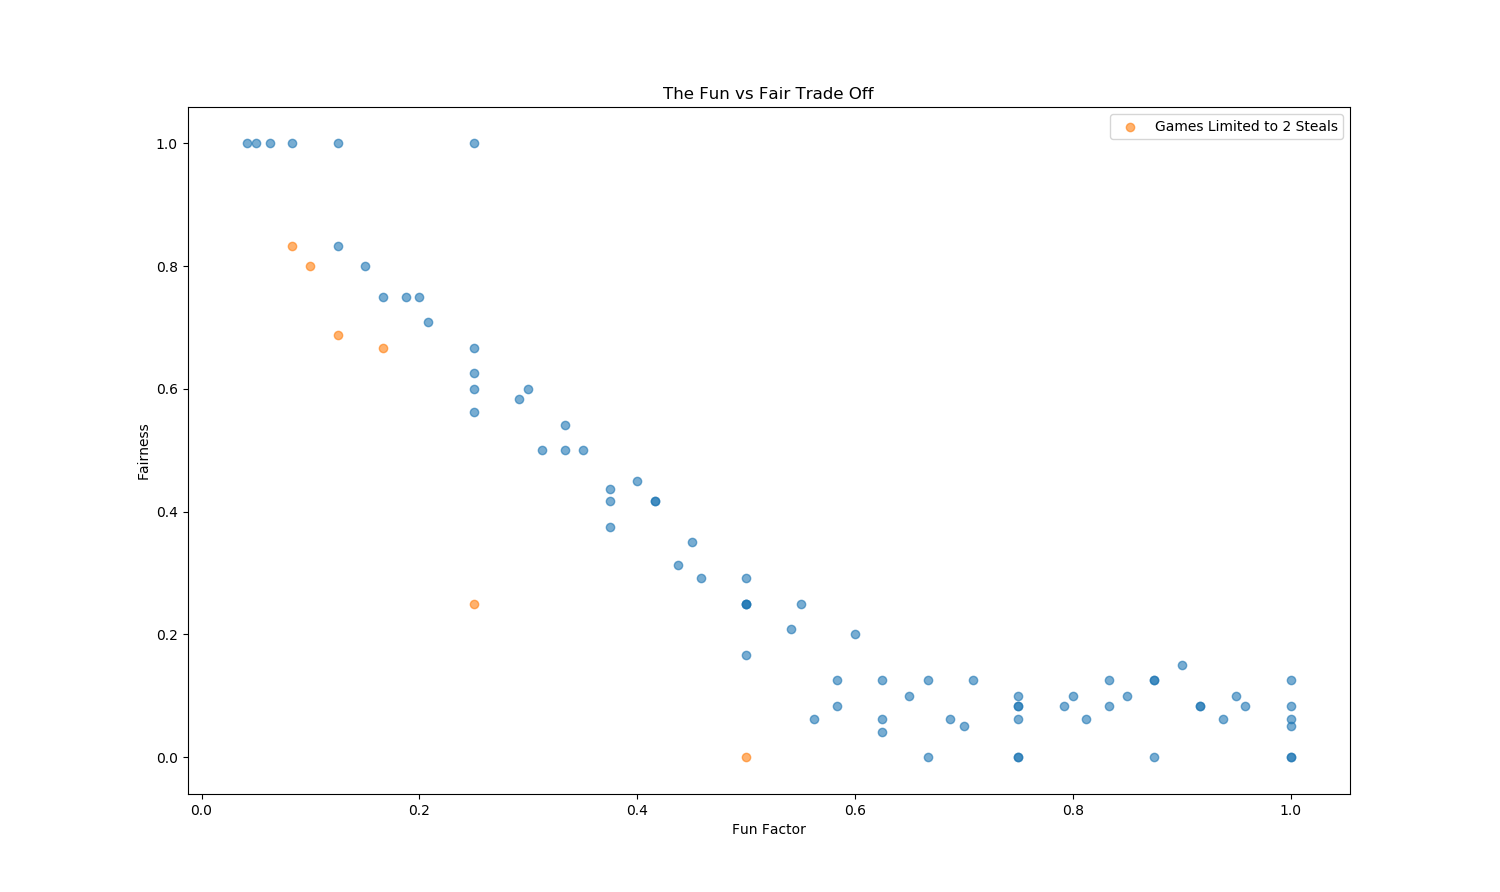
I’ve aggregated a whole range of games with equal numbers of presents valued 1, 5, 10 with varying steal limits and plotted the resulting fairness and fun factors below. You can get the raw numbers here.
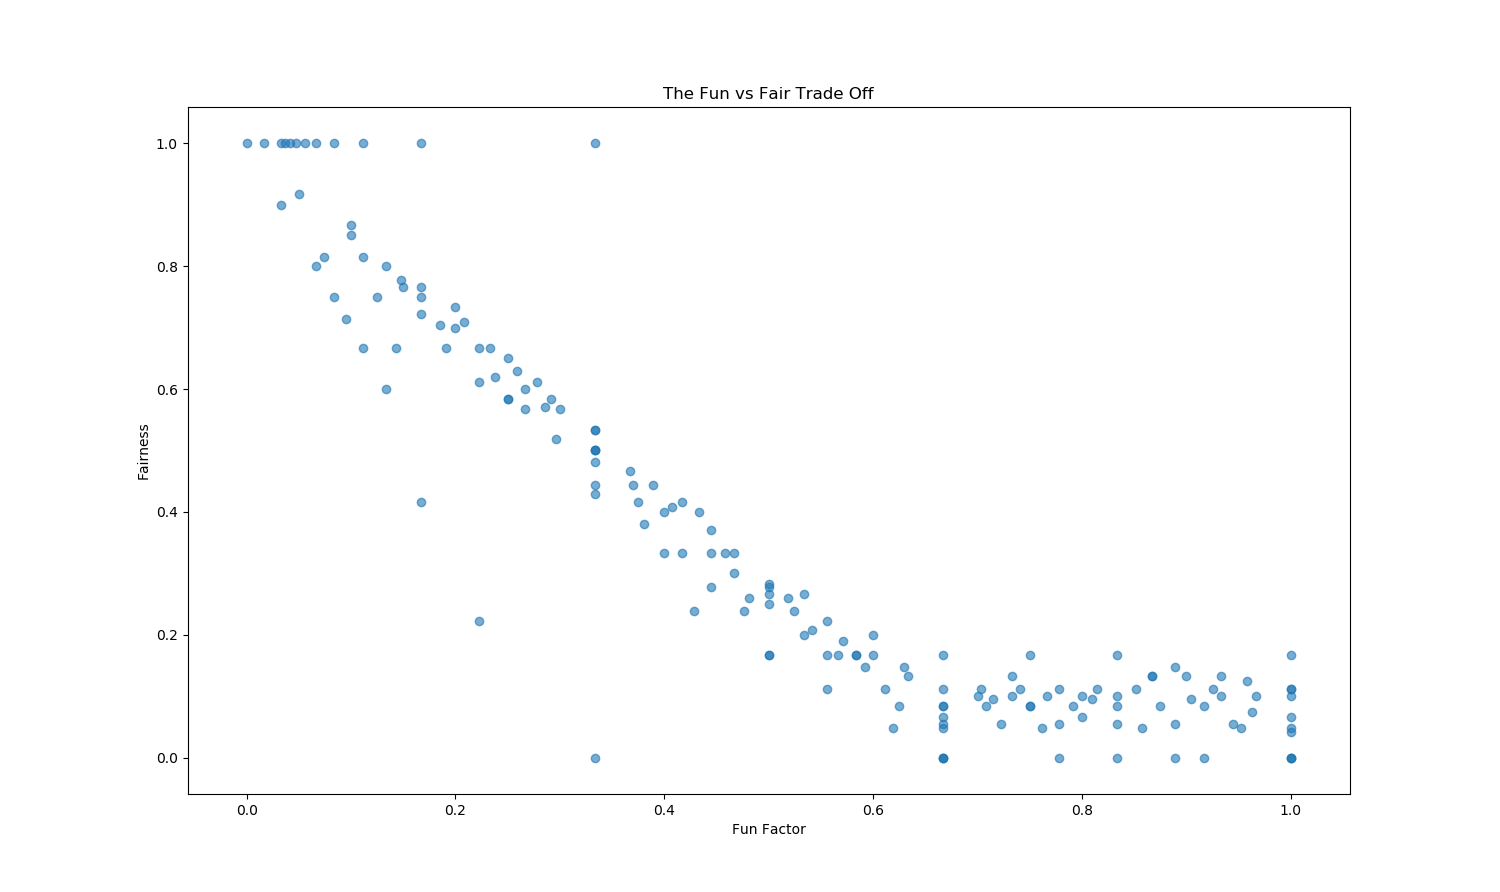
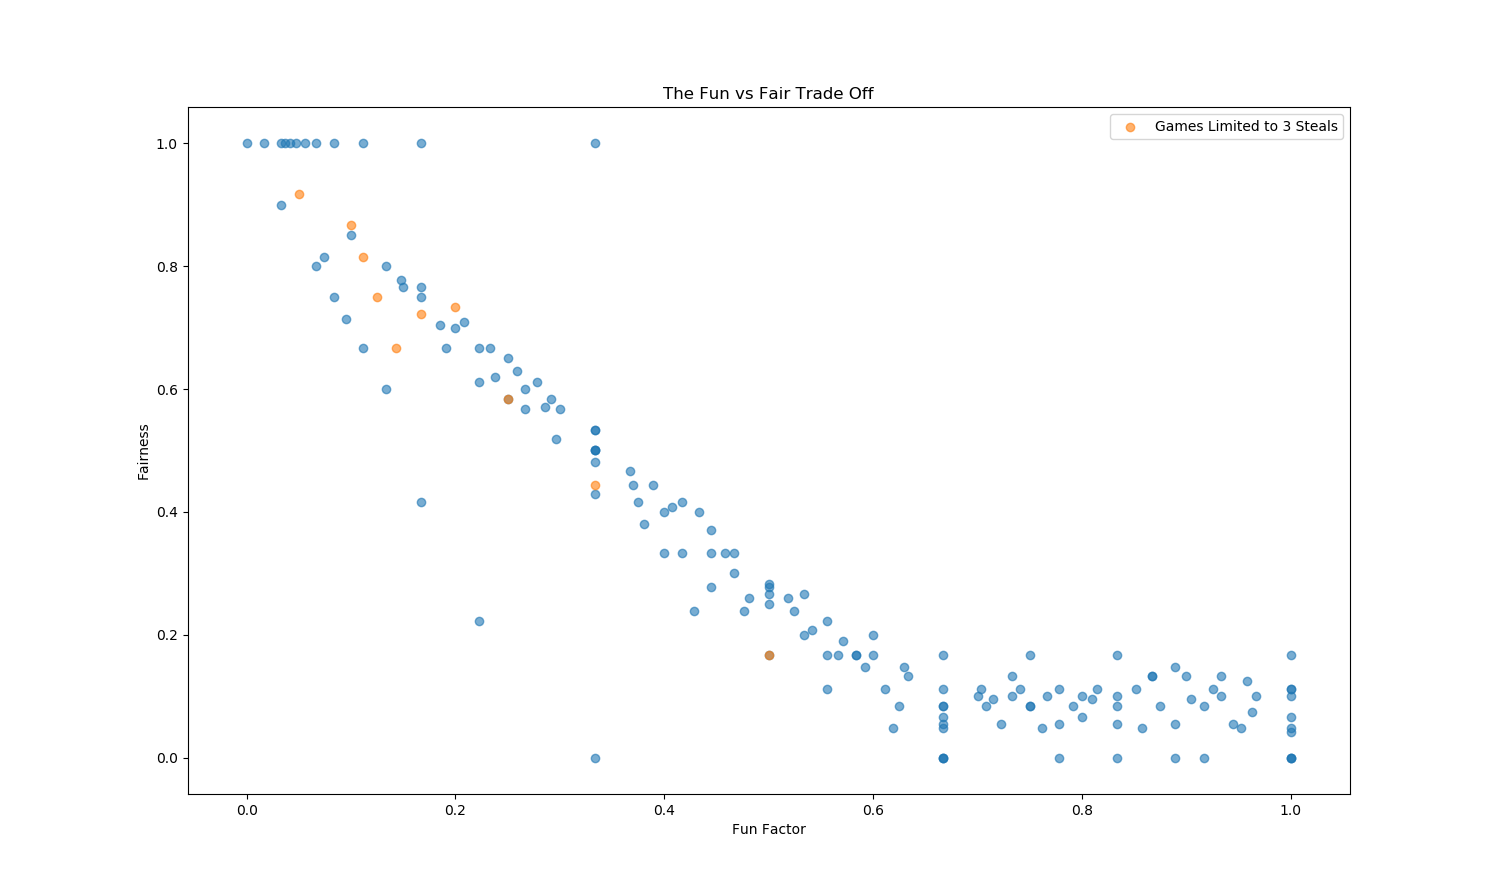
There looks like a clear dog-leg pattern with a few outliers underneath it. I’ve highlighted all the games with a steal limit of 2 below, this conveniently catches all the outliers (for your reference I’ve also highlighted games with steal limits of 1, 3 and 4).
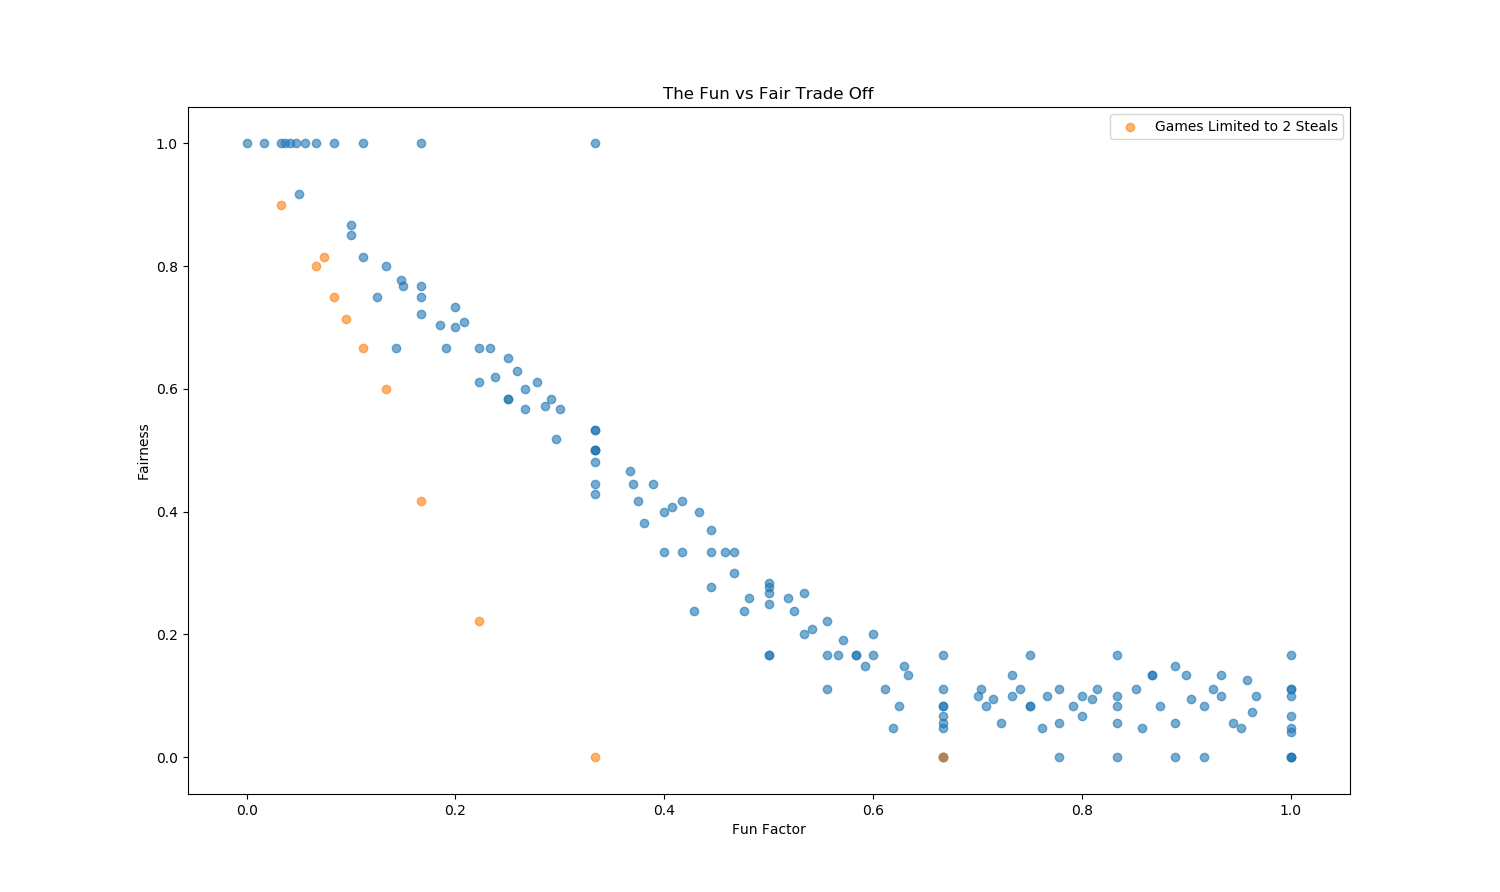
I don’t intend to explore in this post why games with a steal limit of 2 appear special, so I’ll sweep these inconvenient points under the carpet. I’ve also added a linear regression over the ‘interesting’ part of the graph.
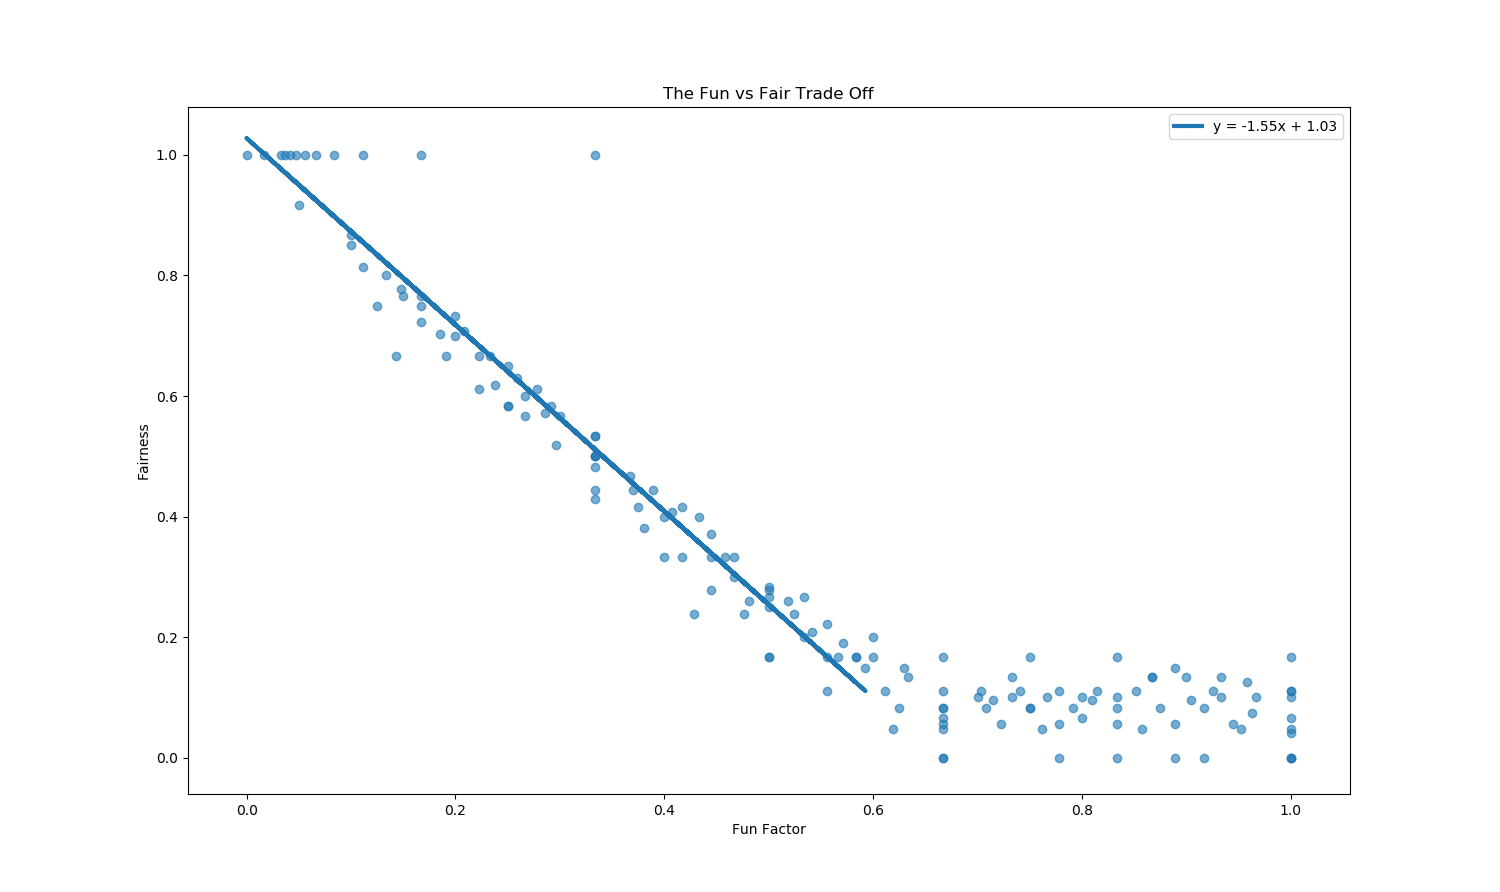
We can use the graph to set a few rules for deciding a fair and fun game:
- Once you reach a fun factor of 0.6 the game doesn't get any fairer. You might as well go all the way and allow unlimited steals (this may be related to the bunching seen in the other charts).
- With fun factor less than 0.6, the relationship between fun factor and fairness is linear according to: fairness = -1.55 * fun factor + 1.03.
You can use these rules to guide how you want to set up your game. You may simply decide to go halfway along the line and set a fun factor of 0.3, to get a fairness 0.565. i.e. for a game with 9 players, allow 3 steals, for a game with 12 players allow 4 steals etc. The choice is up to you.
Some Variety
I’ve assumed presents have uniformly distributed values of 1,5 or 10 in equal quantities. What happens if I reduce this to repetitions of presents valued 1, 5, or extend it to repetitions of 1, 5, 10, 15? How about a skewed distribution with repeating present values of 1, 2, 10? What happens if there aren’t equal quantites of each present like repeating present values of 1, 1, 1, 10? Why do the fairness charts take this pattern?
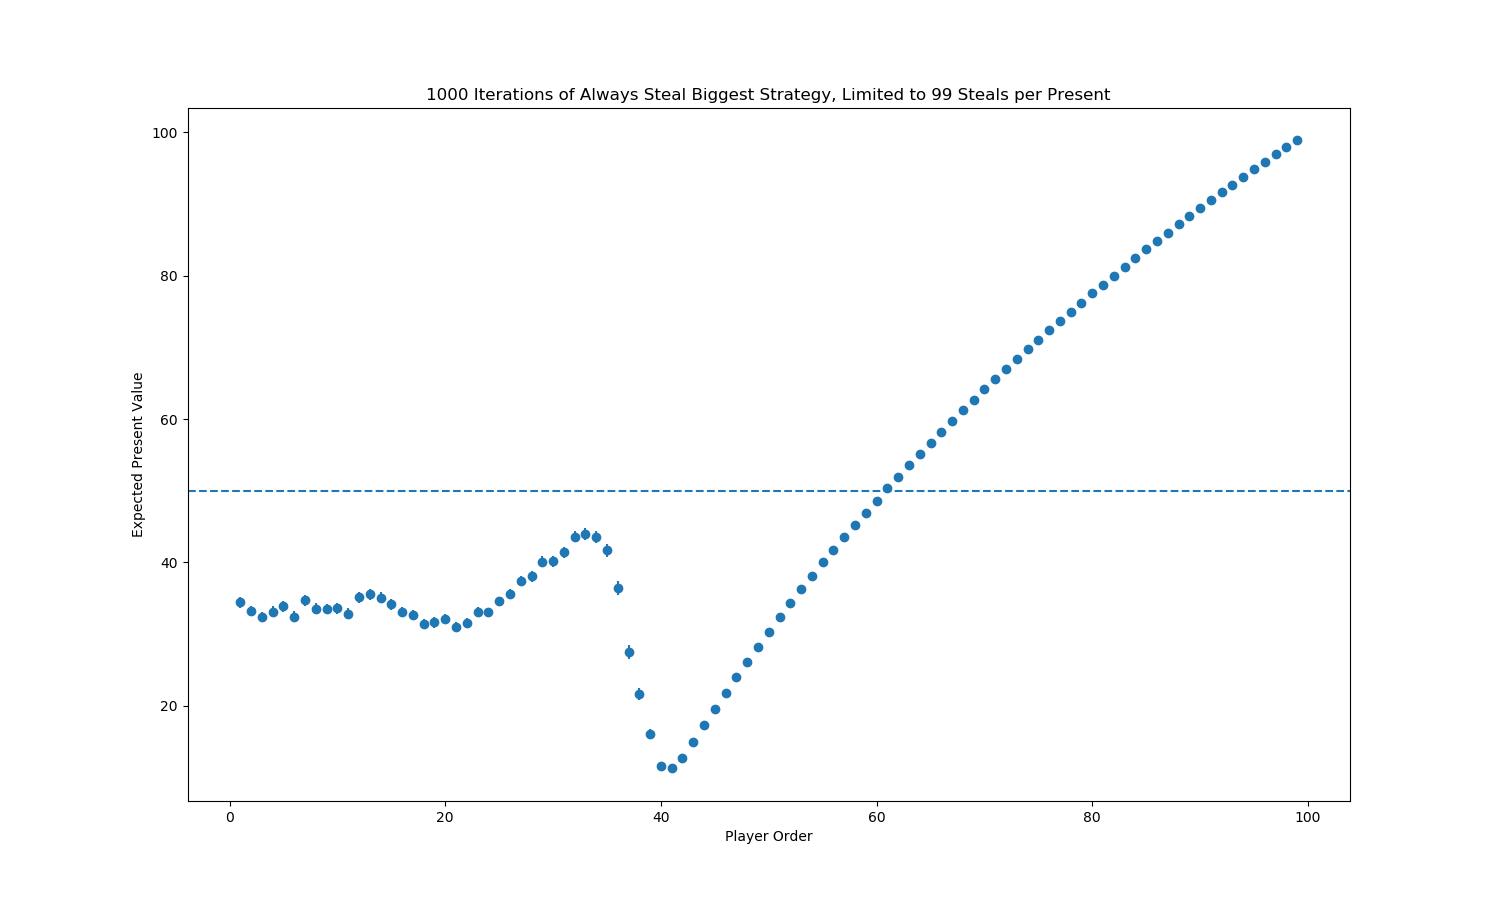
I can also run a model with 99 presents, of value 1 - 100. I’m not sure what exactly is causing this interesting pattern, although I have a few ideas. This all may be something for later exploration.
Close
I hope you’ve enjoyed reading this. We’ve got a graph and a few rules that help us decide where to set a steal limit that’s fair and fun. I’ve left a few unanswered questions (how frustrating!). You’ll have to wait for another post for me to address these. For now, thank you for reading and have a Happy Christmas.